“We charged up our Lithium battery to 14.2V, and the percentage of charge read 100%. Then we used our appliances for a couple of hours, ran the lights, watched a movie, and the battery was at 13.2, which read 90%. Then 30 minutes later, the inverter gave us the low voltage alarm, and everything kicked off. Why did it go down so quickly, did we do something wrong?”
~Sarah & Mark
This plea for understanding came to us in an email a few weeks ago from some friends who had just taken their (new to them) van out on the road for the very first time. They had done all the calculations, ordered the solar equipment, and even completed phase 1 of their solar upgrade. Within their first night, they uncovered a disconnect between what they expected and what they got. No, they hadn’t done anything wrong with their installation, nor with their choice of appliances or equipment. They simply needed to get some real-life experience with their system and battery so they could align their expectations with their experiences.
The percentage charge and the voltage status don’t seem to line up in the way that we expect, sometimes cutting off the movie right at the best part. When we see our battery status go from 100% to 80% over 2 hours of use, we might expect to have 8 more hours at the same usage rate, but that’s not the way deep cycle batteries work, nor how they discharge.
So before we go any further, ask yourself this, “Does the gas tank in my vehicle always go from full to empty at the same rate through each quarter of a tank? In my experience, gas gauges are only accurate at two points: full and empty. And we’ve all likely driven that car in which the first half of the tank seems to last forever, but the final quarter evaporates in an instant — leaving us desperately searching for a gas station.
To any new user of solar batteries, this learning curve is all too common, as is the familiar panic that you’ve hooked up something wrong when the jolting sound of your low voltage alarm goes off — believe me, we’ve been there. Don’t freak at the beep!
Making Sense of Battery Status Percentages
Deep cycle batteries just don’t go from full charge 100% at 12V to 0% charge at 0V, giving off a consistent rate of discharge in an even amount of time. That would be nice, but the laws of Physics (or at least those who interpret them and make voltage scales) did not have the average consumer in mind. When we refer to 12 volts, we are referring to the battery’s “nominal charge” — this is a fancy way of saying that these batteries operate within certain parameters, around approximately 12V. Their real voltage, and therefore charge status, is best understood as a range that varies between the different battery types.
Whether Lithium Iron Phosphate (LFP or LiFePo) batteries, AGM, or Flooded Lead Acid, the battery’s internal chemistry will determine the voltage status range between full and empty, as well as the depth of discharge (DoD) available for each type. Just to make things more complex, battery age, temperature, and whether or not the battery is allowed to rest or has a consistent load on it play a significant role in this as well.
Note: For more about solar battery chemistry and a full cost-benefit analysis of the 4 most common deep cycle solar batteries, check out our blog from December 2020. This will save you research time with deciphering terminology, understanding chemistry, and making an intelligent battery decision that may save you big money down the road — not to mention the headache.
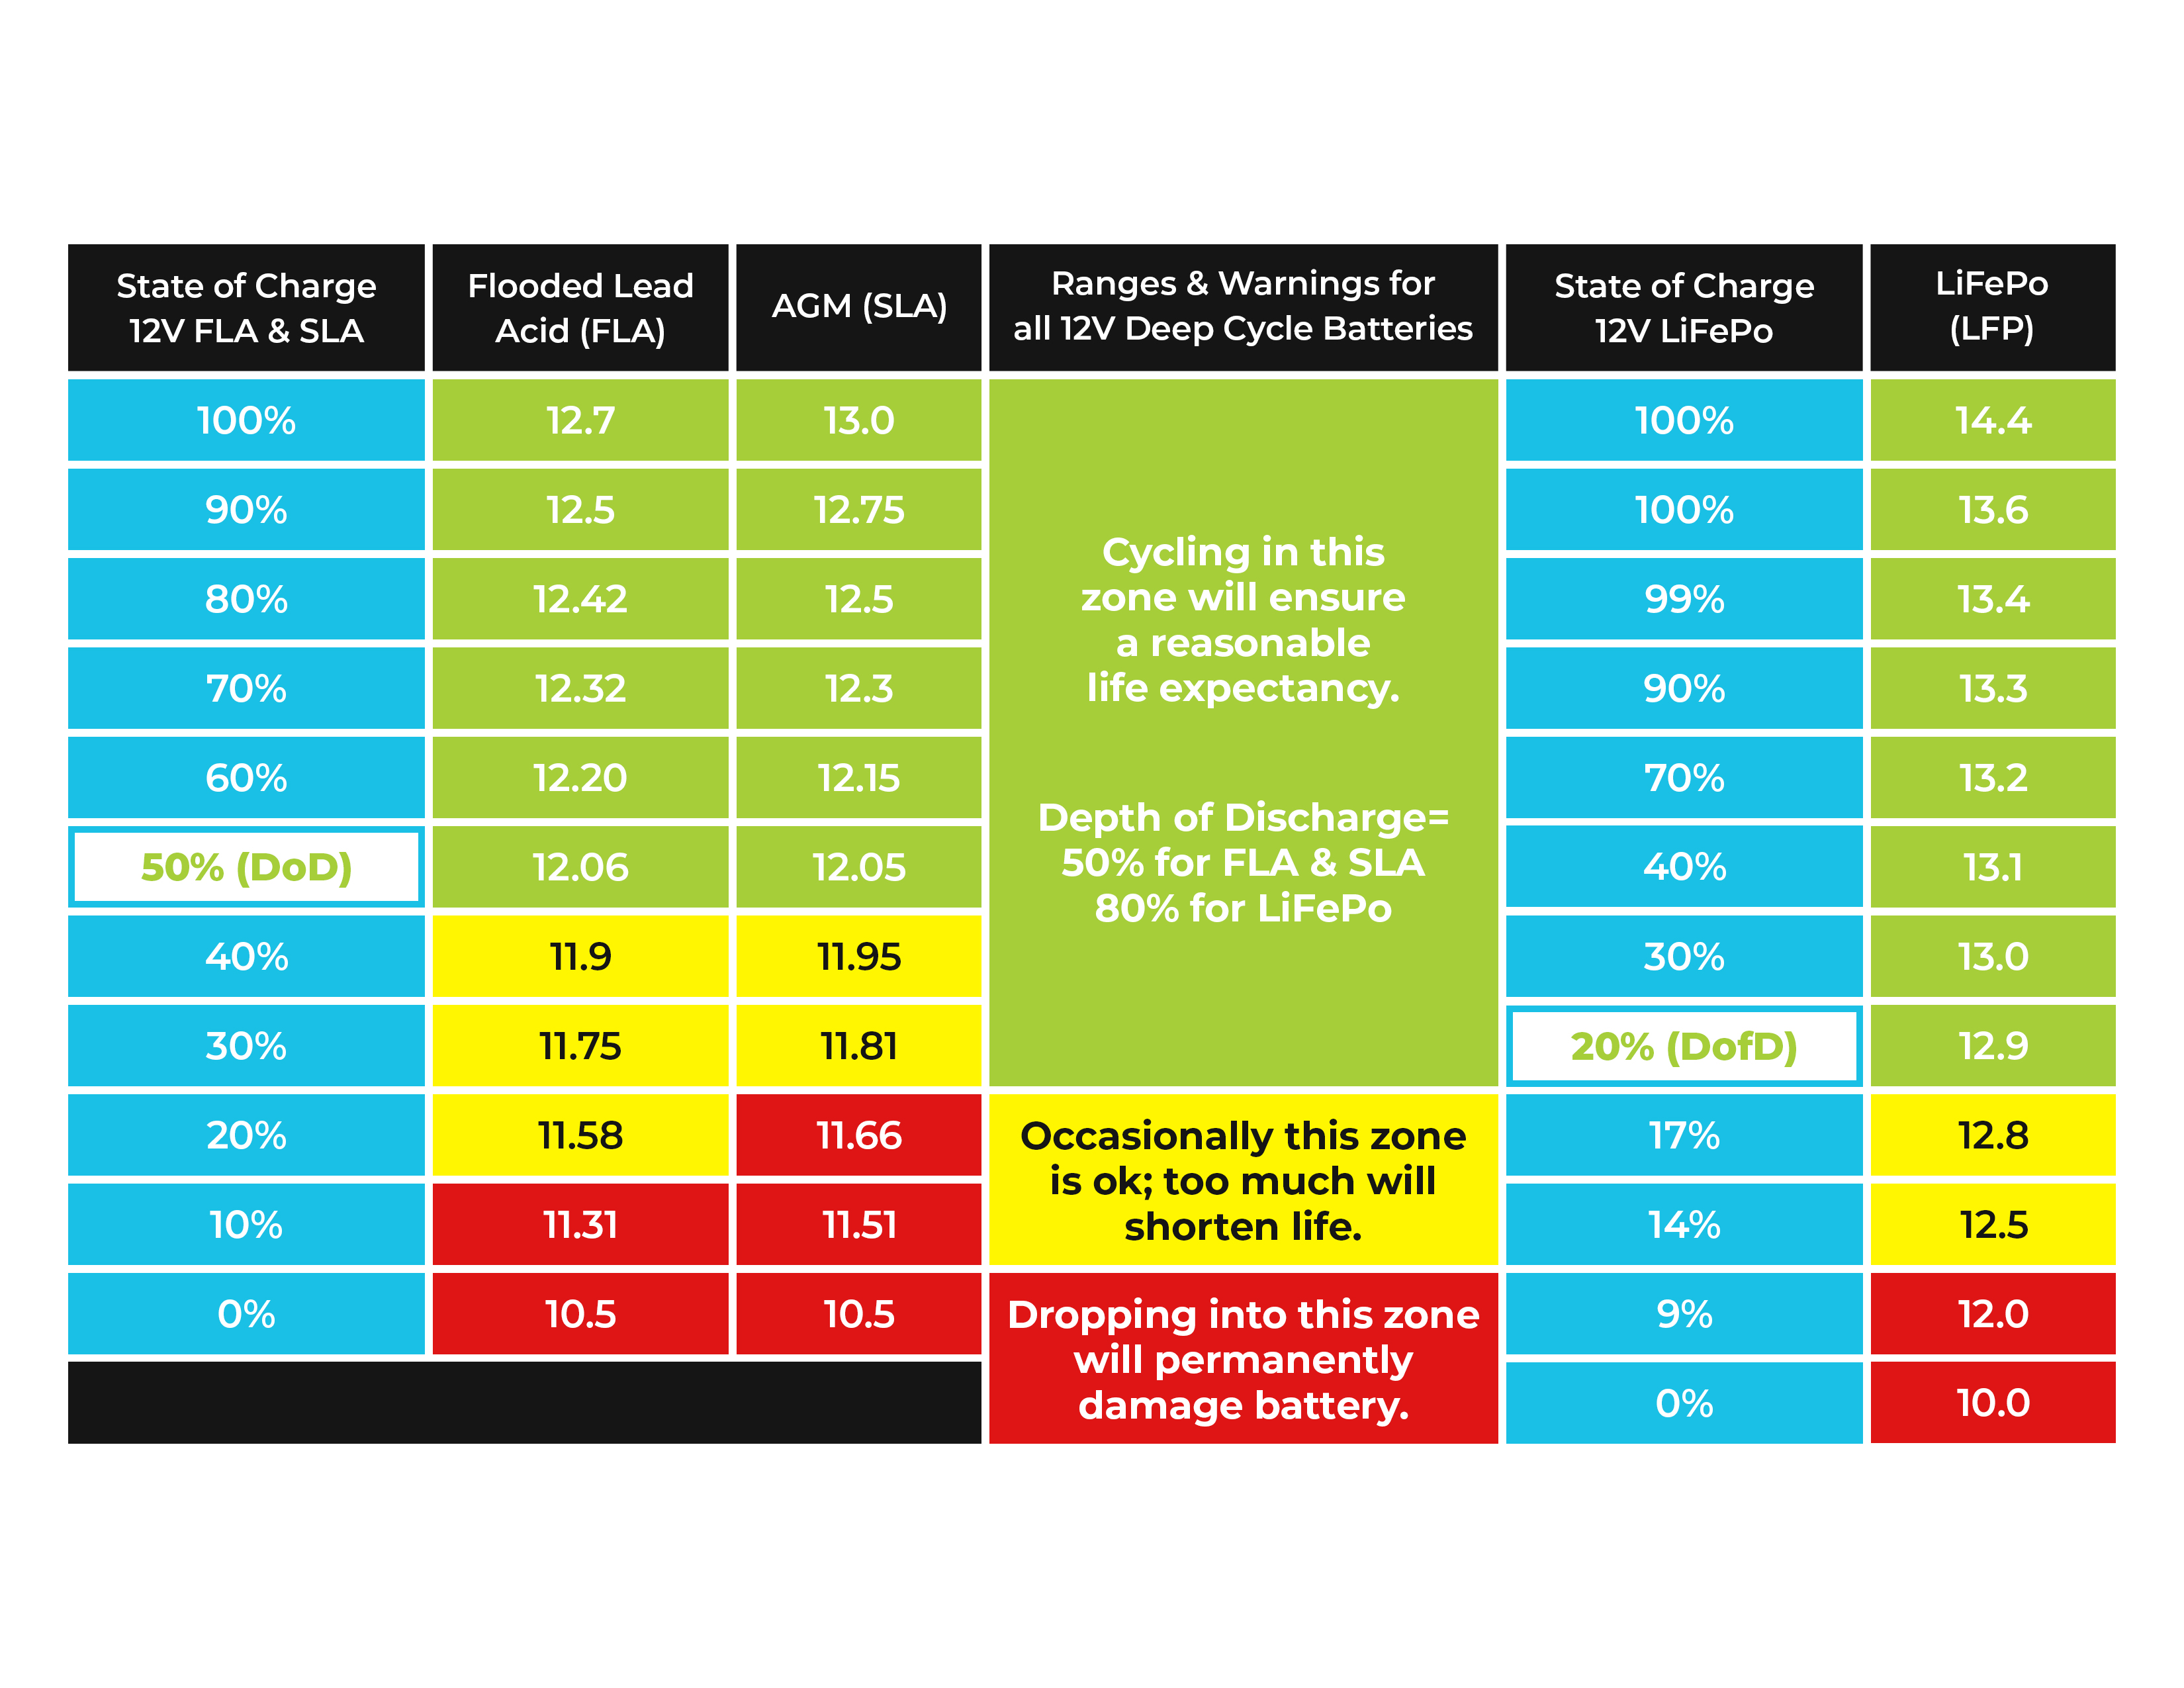
If a picture is worth a thousand words, then a solid graph or chart ought to be worth more. This chart, which we’ve combined together from many online sources, will help you understand the differences between battery types and their appropriate voltage range and percentage of charge. If you are new to solar, bookmark this article or screenshot this page, print out the scale, and put it near your battery monitoring device. I find that this helps reinforce the connection between what we expect and what we experience.
In the chart below, the depth of discharge (DOD) is the safe level to which you can repeatedly and safely discharge the battery without significantly shortening the lifespan of the battery. For Flooded and AGM, this is 50% (50% of capacity); for LiFePo, this is 80% (20% of capacity).

Flooded Lead Acid (FLA) Range
The normal operating range is between 12.7V and 12.06V. This isn’t a huge range and explains why it’s so easy to over-discharge Flooded Lead Acid — which we did on many occasions before upgrading to LiFePo.
AGM (SLA) Range
The normal operating range is between 13.0V and 12.05. While the range is slightly more with AGM batteries, the depth of discharge is nearly the same as Flooded Lead Acid. The real benefit of these batteries is their affordability over the short term and their installation options.
LiFePo Range
The normal operating range for Lithium Iron Phosphate is 14.4V to 12.9V. Compared to both FLA and SLA batteries, the range and depth of discharge are much greater, allowing for significantly more available watt-hours per cycle.
Note: Your battery monitor or smartphone app might give you a slightly different reading depending upon its calibration and the temperature of the battery.
So, let’s return to Sarah & Mark’s van. They left home with a full LiFePo battery (14.2V, 100%) that very shortly became 13.6V, also 100%. (Why exactly it jumps down immediately is one of those details that are best explained or even understood by engineers — for the rest of us, let’s just say that “it does.”) They then turned on their electric water heater (1500W) for about 15-20 minutes, the voltage read 13.2, which showed on their smartphone app as 90% (but should have been 70%), then they ran their lights and turned on their laptop to watch a movie. Before they knew it, they were at 12.8V and heading toward the low voltage cut-off of their inverter. The difference between 70% capacity and 40% is a mere tenth of a volt.
Because their app showed 90% when they started the movie (and probably also plugged in a smartphone to charge), they thought they had plenty of power. But they hadn’t really mentally calibrated the previous energy expenditure with their available charge and projected use for the night. It also didn’t help that the solar panels, which came with the van, weren’t functioning properly (as they discovered later).
The next day they drove to their friend’s house, which charged their battery back to 13.2V via their Dual Input DC to DC On-Board Charger and then plugged in to finish charging with their AC to DC charger. For the rest of the weekend, they left the water heater off and managed to run all of their other appliances without any further problems. Is it a problem that they ran their water heater? Not really. It was when they decided to run their water heater that became the real problem. If they had run the water heater while driving or while they had full sun on their panels (giving the battery a chance to charge back up), they wouldn’t have had any problems. For some real-life strategies on how to maximize a small solar powered system, see tip #3 in this blog.
Battery Discharge Rates
One example that really helped us understand the difference between how Lead Acid (blue line) and LiFePo (orange line) discharge is the operation of our 12V vent fan in “Hamlet,” our 1957 canned ham camper in which we’ve been living and traveling for 8.5 years. When we upgraded to our new Renogy 50 Ah LiFePo battery back in 2019, we had one strange experience. Sometime in the first couple of weeks, we were camping off-grid and running our fan all night long — it was a warm night. I don’t remember what the charge was when we went to bed, but we hadn’t had a lot of sunshine for a few days. Sometime in the middle of the night, our fan just quit running all together, full stop. Just minutes before, it had been running full speed, and then nothing. Now, with our Lead Acid battery, under similar conditions, the fan would just slow down, sometimes to a comically low level, but it never quit. When the sun rose, the fan would speed up as soon as the light hit the solar panel.

The reason this happens is that the LiFePo battery is designed to deliver its “nominal charge” of 12V throughout its entire discharge cycle. Looking back at the State of Charge chart above, the battery only dips below 12V below 9% capacity. So, when it crashes, it crashes hard — as Sarah and Mark discovered. But a Lead Acid battery dips below 12V at just under 50% capacity. So a 12V motor, like the fan, will simply slow down if it’s getting less than its “nominal voltage.” As it slows, it slows the rate of discharge on the battery until it’s simply turning like an unenthusiastic sign spinner at a sleepy intersection. Other appliances that have to have 12V will simply stop operating, like the inverter.

Tools for Monitoring Your Battery Status
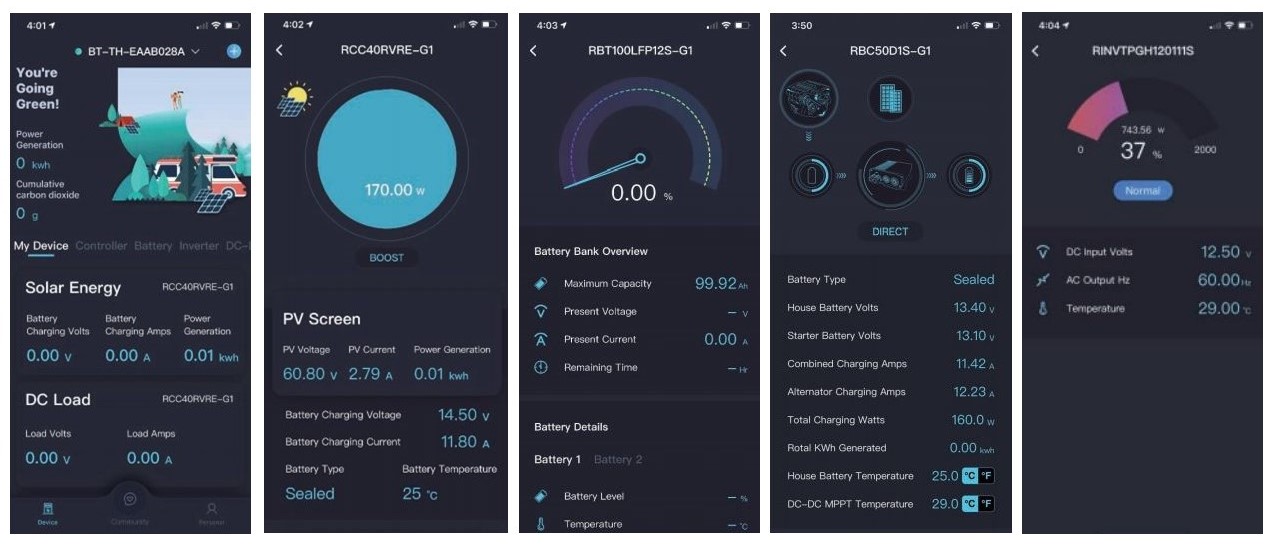
The DC Home App, through the BT-2 Module, is an awesome tool. It displays a lot of information at a glance, including a nice percentage of charge on the battery. But don’t rely too heavily on the percentage of charge. For those who really want to nerd out, a 500A Battery Monitor may be the way to go.

But, being easy to read doesn’t necessarily make it easy to understand. All of this info is great, but what we all really want to know is, “how long can I run my instant pot, laptop, TV, whatever… before I run out of juice?” Our best advice is to make some notes about how long it takes your battery bank to drop from 100% to 75% to 50% (or 20% if you have LFP) under normal daily usage. Doing this will help you get your head around what these numbers mean for YOU. Getting familiar with YOUR system, YOUR appliances, and YOUR lifestyle takes some time and a good deal of practice. But, keep on, keepin ‘on because the benefits of solar freedom are worth the work…and you’ll have some awesome fodder for that next dinner party. Remember those? We can’t wait to attend one.

Shari Galiardi & David Hutchison have turned their higher education backgrounds, desire for life-long learning, and thirst for adventure travel into writing, photography, video production, and public speaking tours from coast to coast. Known to their friends as simply Shari & Hutch, you can learn more about their full-time, solar-powered adventures on their website at freedominacan.com. Or, follow them on Facebook, Instagram, and YouTube as “Freedom in a Can.”


